
Carbon's Harsh Ride: Same Watts, Harder Work
Vibration transferred from riding surface through bike to rider makes the heart and lungs work harder for a given watts production.
TL;DR
Thirty trained cyclists rode carbon road bikes at fixed power, with and without surface vibration. Across three bike models in two papers, heart rate rose 5–7% with vibration. Oxygen uptake rose 2–4%, and each heartbeat did 5–7% less work.
Same watts, more effort
Every rough surface vibrates the bike and thereby the rider. This article asks what that costs the rider.
The question this article answers is specific. At the same pedaling power, does vibration alone make the rider work harder? A 2021 study in Medicine & Science in Sports & Exercise measured exactly that. The answer is yes: with vibration, heart rate rose 5–7% at the same power.
The test
Viellehner and Potthast tested 30 trained male cyclists. Viellehner, J., & Potthast, W. (2021). The effect of cycling-specific vibration on neuromuscular performance. Medicine & Science in Sports & Exercise, 53(5), 936–944. Riders: 30 men, 75.9 kg average mass, VO2max 63 mL/kg/min, more than 4,000 km a year. Each rode more than 4,000 km a year. Their average VO2max was 63 mL/kg/min.
All of the bikes in the study were carbon. It held the bike and the power constant and switched the vibration on and off. That isolated the cost of the vibration itself.
Everyone rode the same model of carbon road bike on a trainer. Two vibration plates drove the dropouts the way a cobbled road vibrates the wheels:
- Front dropout: 44 Hz, about 4 mm amplitude.
- Rear dropout: 38 Hz, about 3.5 mm amplitude.
Riders held two steady power levels:
- Low: 137 W on average, an easy endurance pace.
- Moderate: 221 W on average, about 60% of VO2max.
Each level lasted 12 minutes. The first 6 minutes ran without vibration and the last 6 with it. Heart rate and oxygen uptake were averaged over the last 3 minutes of each block, once breathing and heart rate had leveled off. Steady-state values. Heart rate and oxygen uptake from Table 4 of the same paper; muscle activation from Tables 1–3, at 221 W, relative to the no-vibration baseline.
“…an increase in heart rate and oxygen demand with vibration indicates a performance loss…”
— Viellehner and Potthast, Medicine & Science in Sports & Exercise, 2021 Viellehner, J., & Potthast, W. (2021). The effect of cycling-specific vibration on neuromuscular performance. Medicine & Science in Sports & Exercise, 53(5), 936–944. Riders: 30 men, 75.9 kg average mass, VO2max 63 mL/kg/min, more than 4,000 km a year.
Two road conditions, one bike
The animation runs both test conditions side by side. The riding surface on the left shows cobbles, which induce vibration. The surface on the right is smooth. The rider put out the same watts on the same bike on both surfaces.
How to read the animation:
- The ride: both riders start from a stop and spin up to 90 rpm. They hold 137 W, step up to 221 W, then coast to a stop.
- Heart rate: the large number under each rider. The red figure between them is the gap in work per heartbeat.
- Running totals: the bars at the bottom add up the work each rider gets from the same heartbeats and the same liters of oxygen. Longer is better.
How the running totals work. The study reports steady-state averages, not totals. We turned those averages into work per heartbeat: power × 60 ÷ heart rate. At 221 W, each beat did 82.4 joules of work with vibration and 87.8 without.
Oxygen works the same way. Oxygen uptake × the riders’ 75.9 kg average mass gives liters per minute. Power × 60 ÷ that gives joules per liter: 4,122 with vibration, 4,212 without, at 221 W.
The animation then counts 1,000 heartbeats and 20 liters of oxygen. It assumes each rider holds the study’s steady state that long. The study measured 3-minute averages, so the totals are a projection. After 1,000 beats, the vibration rider has done 74.7 kJ of work and the smooth-road rider 79.0 kJ.
What is illustrative, not measured. The spin-up and coast-down, the 90 rpm cadence, the 55 bpm start and the 110 bpm finish are for the story. So are the oxygen values at both ends. The steady-state heart rate and oxygen values come from the study. The vibration is exaggerated so it shows on screen.
What the data show
Vibration raised heart rate at both power levels: 5% at 137 W and 7% at 221 W. The gap grew as the riders worked harder. Oxygen uptake rose 2–4%.
| Measure | 137 W, vibration | 137 W, none | Change | 221 W, vibration | 221 W, none | Change |
|---|---|---|---|---|---|---|
| Heart rate, bpm | 129 | 123 | +5% | 161 | 151 | +7% |
| Oxygen uptake, mL/kg/min | 29.3 | 28.3 | +4% | 42.4 | 41.5 | +2% |
| Work per heartbeat, J | 63.7 | 66.8 | −5% | 82.4 | 87.8 | −6% |
| Work per liter of oxygen, J | 3,691 | 3,826 | −4% | 4,122 | 4,212 | −2% |
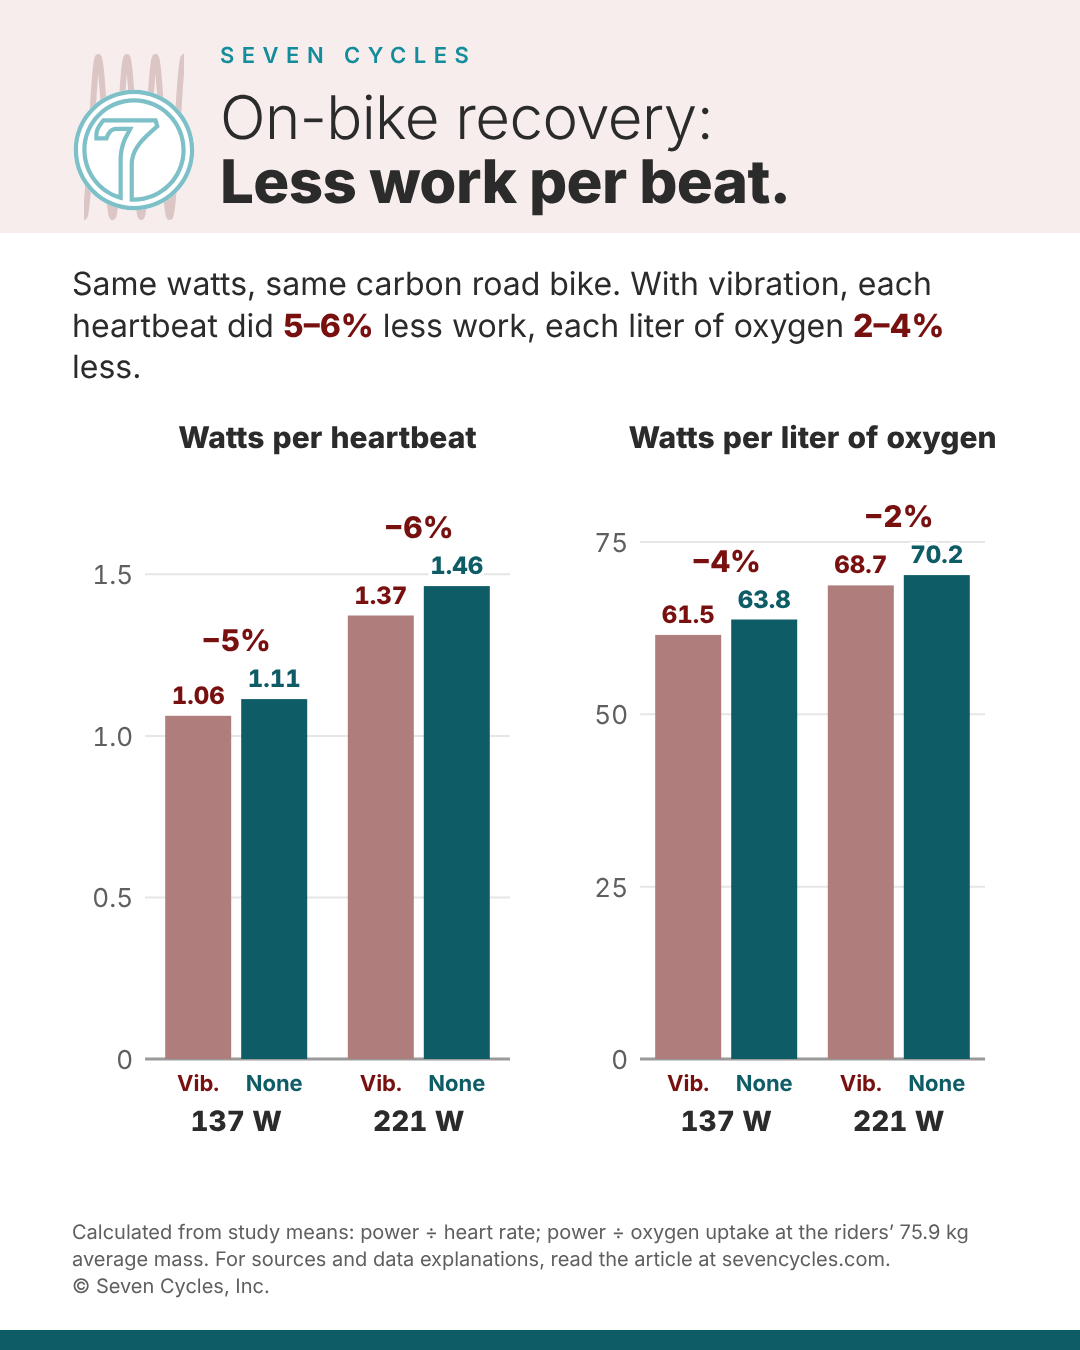
How to read the chart. The watts chart shows watts per heartbeat. Higher is better. The liter of oxygen chart shows watts per liter, so higher is better. Red bars are the vibration surface; teal bars are the smooth surface.
Heart rate and oxygen uptake are the study’s means (Table 4 in the paper). Work per heartbeat and per liter are our calculations from those means.
The same results on more bikes
A companion paper by the same authors ran the same 221 W test on two more carbon bikes. Viellehner, J., & Potthast, W. (2019). Road bike damping: comfort or performance related? ISBS Proceedings Archive, 37(1), Article 33. Bikes: 2017 Specialized Tarmac SL5 Expert, and 2017 Specialized Roubaix Comp with its stock Future Shock stem unit and flexible seatpost. Same 30 riders and vibration, 221 W. Vibration pushed heart rate to 161 bpm on both. Every bike tested showed the same pattern.
| Bike | Heart rate, no vibration | Heart rate, vibration | Heart rate change | Oxygen change | Work per beat change |
|---|---|---|---|---|---|
| Tarmac Pro Race, 2015 * | 151 bpm | 161 bpm | +7% | +2% | −6% |
| Tarmac SL5 Expert, 2017 † | 150 bpm | 161 bpm | +6% | +2% | −7% |
| Roubaix Comp, 2017 † | 153 bpm | 161 bpm | +5% | +2% | −5% |
* Viellehner and Potthast, 2021. Viellehner, J., & Potthast, W. (2021). The effect of cycling-specific vibration on neuromuscular performance. Medicine & Science in Sports & Exercise, 53(5), 936–944. Riders: 30 men, 75.9 kg average mass, VO2max 63 mL/kg/min, more than 4,000 km a year. † Viellehner and Potthast, 2019. Viellehner, J., & Potthast, W. (2019). Road bike damping: comfort or performance related? ISBS Proceedings Archive, 37(1), Article 33. Bikes: 2017 Specialized Tarmac SL5 Expert, and 2017 Specialized Roubaix Comp with its stock Future Shock stem unit and flexible seatpost. Same 30 riders and vibration, 221 W. All three are Specialized carbon road bikes; the year is the bike’s model year. All rows are 221 W means. Heart rate and oxygen changes are as each paper reports them; work per heartbeat is our calculation (power ÷ heart rate). All three rows come from the same 30 riders and the same lab.
Why it matters for bike frames
A rider’s frameset (and some other components) influences how much road vibration reaches the rider. Stiffness in the vertical plane passes more of it along. Vertical compliance soaks up some of the vibration.
This study shows what the vibration costs once it reaches the rider. At a steady 221 W, each heartbeat did 6% less work. The cost appeared on every bike tested.
Caveats
- Fixed order. Each block ran without vibration first, then with it. Heart rate tends to drift upward during a steady effort, so some of the rise may be drift rather than vibration. The authors state the order was not randomized.
- Short efforts. The values are 3-minute averages. The study did not measure fatigue or recovery after the ride; the authors call fatigue testing the next step.
- Lab vibration. Plates drove the dropouts in a fixed rhythm. Real roads shake the bike less evenly.
- Oxygen is the weaker signal. The authors place the 2.7% average rise close to measurement precision.
- Funding. Specialized Bicycle Components funded the study. The authors report no conflicts of interest.
- Our math. Work per heartbeat, work per liter and the running totals are our calculations from the study’s means. The start and end values in the animation are illustrative.