
Anodized Titanium: Shorter Service Life
TL;DR
A research paper by Leinenbach and Eifler fatigue-tested and compared anodized and unanodized titanium. Leinenbach, C., & Eifler, D. (2009). Influence of oxidation treatment on fatigue and fatigue-induced damage of commercially pure titanium. Acta Biomaterialia, 5(7), 2810-2819. Rotating-bending data from Fig. 5b; surface and residual-stress values from Section 3.1; damage threshold from Section 3.4; mechanism from Section 4. The bending fatigue results were not good for anodized parts. For example, both unanodized bars ran 2 million cycles without breaking. The fitted curve for the anodized test samples shows that a typical sample breaks after about 430,000. That's about 13% of the unanodized test pieces.
This article is part of our Titanium Framebuilding series. Check out Seven's related articles.
Bike Industry Corollary: Fatigue data specific to bike industry anodization techniques does not exist. This paper is the closest to bike industry ano as we've found. In future articles, we'll dig into ways we use corollary anodize and oxide third-party test data to better understand the issues with simple voltage anodizing.
Two bars, one Stress
The animation runs two fatigue testers side by side. Each bar is the same polished titanium surface finish. The one on the left carries an anodized surface about 0.1 µm thick. The one on the right has no film.
Each fatigue test sample undergoes cyclic (R = -1) loading. The results are:
- Anodized: breaks at about 430,000 revolutions, about 22% of the targeted 2 million cycles.
- Unanodized: reaches 2 million revolutions and is stopped. Those samples never broke.
How to read the animation: The rose dot marks the point of highest stress. It stays still while the bar turns under it. The wave boxes show the stress point on the surface. During spin-up, each wave is one turn. After that, the waves pile up from left to right on a 0-2 million-turn scale, so the length of each stack is the bar's life. The bend is exaggerated for process clarity.
The outcome in one picture. The bars at the bottom put both lives on the same 0-2 million-turn scale. The arrow past 2 million means the unanodized bar's true life is longer; the test was stopped before it broke. That makes its life more than 4-and-a-half times that of the anodized bar.
How rotating bending works
Push down (or pull down) on the end of a bar and it bends. The top surface stretches into tension. The bottom is forced into compression. The center carries almost no load. Now spin the bar. Each point on its surface rides over the top into tension, then under the bottom into compression, once per revolution. The tension and the compression are equal, so the stress ratio is R = -1, fully reversed.
The test
Leinenbach and Eifler tested commercially pure titanium, Grade 2: yield strength 389 MPa, tensile strength 493 MPa. They ground every test piece to 4000 grit and polished them to Ra 0.04 µm. Half were then anodized in 1 M sulfuric acid at a constant 10 mA/cm², stopping at 40 V. The authors read the oxide thickness as 90-100 nm. The film was mostly amorphous, with fine nanometer pores. Leinenbach, C., & Eifler, D. (2009). Influence of oxidation treatment on fatigue and fatigue-induced damage of commercially pure titanium. Acta Biomaterialia, 5(7), 2810-2819. Rotating-bending data from Fig. 5b; surface and residual-stress values from Section 3.1; damage threshold from Section 3.4; mechanism from Section 4.
“...rotating bending tests ... are more sensitive towards surface influences...”
— Leinenbach and Eifler. Influence of oxidation treatment on fatigue and fatigue-induced damage of commercially pure titanium.
Voltage impacts fatigue strength
40 volts is relatively low on the color spectrum. The upper range for the brightest colors is over 300 v. The lower the voltage, the thinner the anodization oxide later. So, 40 v equates to about 14% of the thickest likely oxide. The thicker the oxide, the greater the reduction in fatigue life.
The bars were tested in rotating bending at 10 Hz, R = -1, in oxygen-saturated Ringer's solution at 37 °C. The pieces that reached 2 million cycles without breaking was stopped. Its true life is longer than 2 million turns, but it is unclear by how much. The chart labels these “Test stopped.” Leinenbach, C., & Eifler, D. (2009). Influence of oxidation treatment on fatigue and fatigue-induced damage of commercially pure titanium. Acta Biomaterialia, 5(7), 2810-2819. Rotating-bending data from Fig. 5b; surface and residual-stress values from Section 3.1; damage threshold from Section 3.4; mechanism from Section 4.
Axial tests versus bending tests
The same paper also ran axial fatigue tests on the same anodized and unanodized bars. Leinenbach, C., & Eifler, D. (2009). Influence of oxidation treatment on fatigue and fatigue-induced damage of commercially pure titanium. Acta Biomaterialia, 5(7), 2810-2819. Rotating-bending data from Fig. 5b; surface and residual-stress values from Section 3.1; damage threshold from Section 3.4; mechanism from Section 4. There, the results came out differently: anodizing made little difference. We'll look at the axial tests in our next anodizing article, and explain why the same film costs life in bending but not in axial tests. In short, for bike frames, axial fatigue strength matters less than bending. Pedaling, braking, and rough roads mostly load the frame in bending and torsion (twisting). Both put the highest stresses at the tube surface, right where the anodized film is. Bending is the main fatigue load in a frame, with torsion close behind, which is why this article focuses on bending fatigue data.
What the data show
The chart includes every sample tested in rotating bending. Each marker is one sample: stress on the vertical axis, revolutions to failure on the horizontal. The data reflects the animation above.
- Unanodized: two bars ran 2 million turns at 400 MPa without breaking. The authors put the endurance limit above 400 MPa.
- Anodized: no bar survived, even at 360 MPa. The lowest failed at about 1.7 million turns. The authors estimated the endurance limit near 350 MPa.
That is a loss of at least 12.5% in endurance limit. It is “at least” because they did not test a polished sample at 400 MPa long enough to find where it would fail. Leinenbach, C., & Eifler, D. (2009). Influence of oxidation treatment on fatigue and fatigue-induced damage of commercially pure titanium. Acta Biomaterialia, 5(7), 2810-2819. Rotating-bending data from Fig. 5b; surface and residual-stress values from Section 3.1; damage threshold from Section 3.4; mechanism from Section 4.
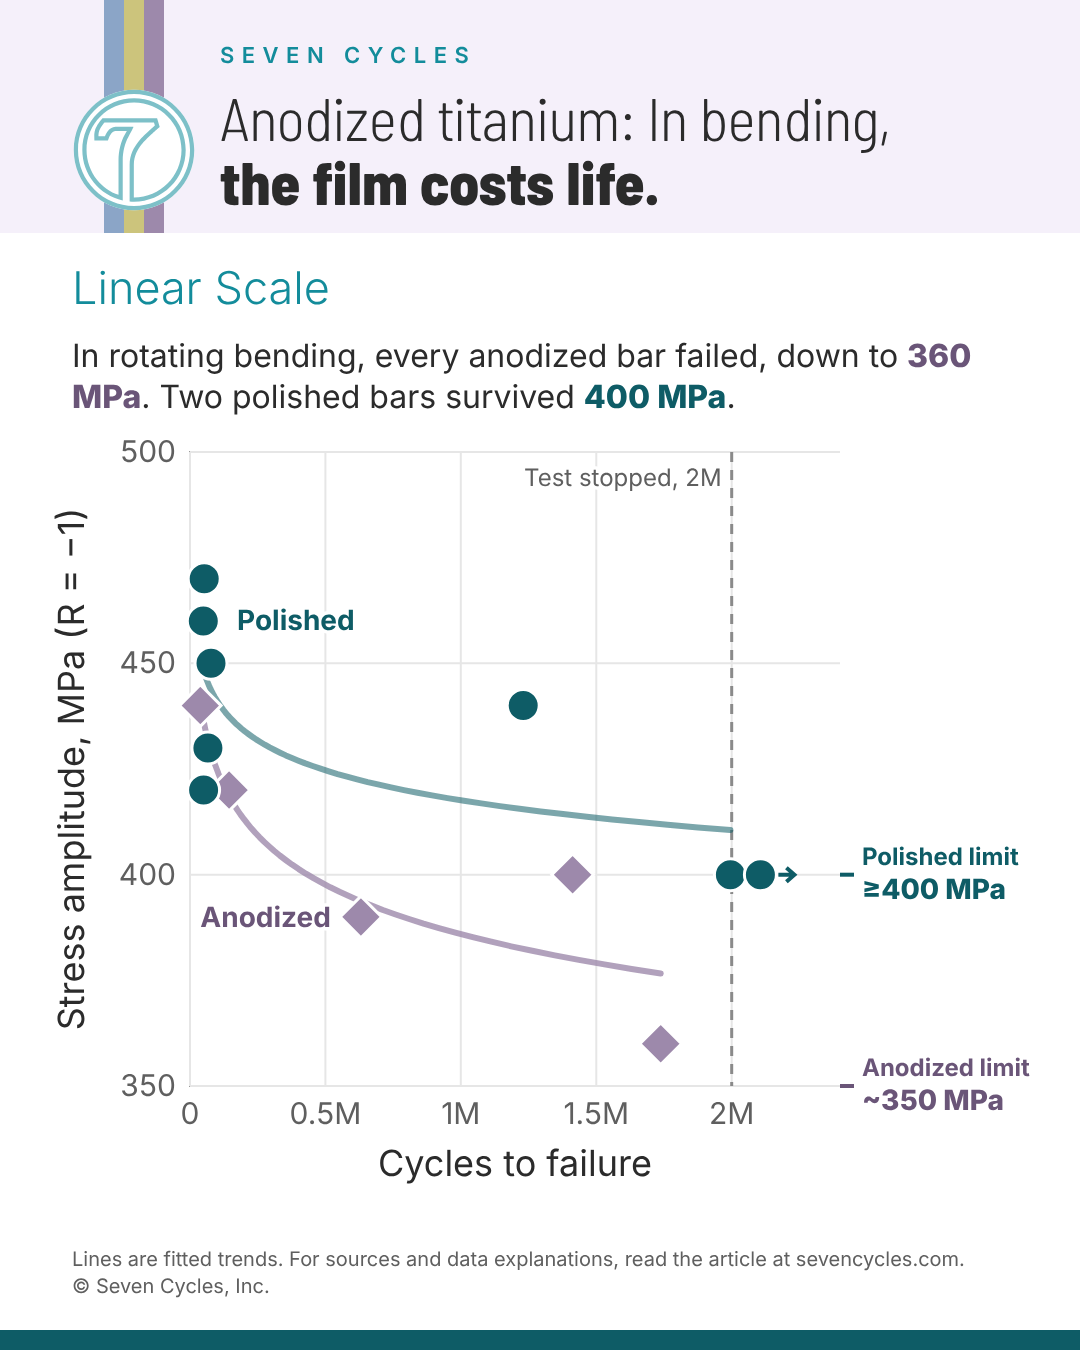
How to read the chart. Dark teal circles are unanodized. Purple markers are anodized. The two runouts, tests stopped at 2 million turns, sit just past the dashed “Test stopped” line, marked by an arrow. Both axes are linear, so the many short-lived bars crowd together near zero and the fitted lines curve. We traded values from the paper's Fig. 5b, so they are approximate. Leinenbach, C., & Eifler, D. (2009). Influence of oxidation treatment on fatigue and fatigue-induced damage of commercially pure titanium. Acta Biomaterialia, 5(7), 2810-2819. Rotating-bending data from Fig. 5b; surface and residual-stress values from Section 3.1; damage threshold from Section 3.4; mechanism from Section 4. The lines are our least-squares fits of stress against log life, with runouts counted as failures at 2 million turns. With five to eight bars per line, read them as groupings, not precise curves.
Why 430,000 turns: best case is not the likely case
The animation breaks the anodized bar at about 430,000 turns. That number comes from the fitted line through all five anodized bars: at 400 MPa it predicts 434,000 turns, and the reverse fit gives 425,000. Leinenbach, C., & Eifler, D. (2009). Influence of oxidation treatment on fatigue and fatigue-induced damage of commercially pure titanium. Acta Biomaterialia, 5(7), 2810-2819. Rotating-bending data from Fig. 5b; surface and residual-stress values from Section 3.1; damage threshold from Section 3.4; mechanism from Section 4.
One anodized sample was run at 400 MPa and lasted about 1.4 million cycles. That is real, but it is a single bar from a scattered set: the best result, not the typical one. Fatigue data always scatter. An engineer setting a safety margin designs from the curve, or below it, never from the luckiest specimen.
Even that lucky bar fell short of the 2 million turns both unanodized bars survived.
Why anodizing costs life in bending
The usual suspects are ruled out. Anodizing made the surface smoother (which typically enhances fatigue strength), left its compressive residual stress unchanged, and improved corrosion resistance. The loss comes from the film itself and how it is attached.
The authors' explanation, step by step: Leinenbach, C., & Eifler, D. (2009). Influence of oxidation treatment on fatigue and fatigue-induced damage of commercially pure titanium. Acta Biomaterialia, 5(7), 2810-2819. Rotating-bending data from Fig. 5b; surface and residual-stress values from Section 3.1; damage threshold from Section 3.4; mechanism from Section 4.
- Under cyclic load, the titanium slips or shears under the brittle oxide surface. Any slip creates cracks which ultimately grow and become the failure point.
- The anodic film is only weakly bonded. The transition zone to the metal is about 15 nm (measured on a related alloy). Slip below it makes the film peel away locally.
- Once the strain is high enough, the loose film cracks.
- Stress concentrates at the broken patches. Titanium is notch-sensitive, so fatigue cracks start there earlier than on a bare surface.
Why it matters for bike frames
Frame tubes and junctures are stressed mostly in bending, so the paper's bending-stress test data most closely matches how a frame is loaded.
Caveats
- Few bars, no statistics. Five anodized and eight unanodized bars in R = -1 rotating bending. The paper says the fatigue tests “were not evaluated by statistical methods.” The endurance limits are the authors' estimates.
- The -12.5% is a floor or worst case. The unanodized limit is “at least 400 MPa” because only two unanodized bars ran at 400 MPa, and both survived.
- The animation's break point is estimated. 430,000 cycles come from the fitted line; the one anodized bar run at 400 MPa lasted about 1.4 million.
- Values are traced from the paper's Fig. 5b, so they are approximate (about ±5 MPa).
- Soft alloy. Grade 2 CP titanium, not a frame alloy.
- Saline, not air. Tests ran in Ringer's solution at 37 °C.
- Thickness is estimated from color, not measured.
- The animation is not to scale. The bend is exaggerated, and the counter is fast-forwarded.
- The authors' fatigue-testing equipment hung a weight from a bearing on the free end. The animation shows the load as a push instead. Both bend the bar the same way, so the stress is the same.