
Rough surface, short life: printed vs. wrought titanium
Vibration transferred from riding surface through bike to rider makes the heart and lungs work harder for a given watts production.
TL;DR
A titanium alloy study tested 3D-printed and wrought Ti‑6Al‑4V samples in fatigue until they broke. The printed samples lasted just 15% to 33% as long as wrought, and the printed parts' rough surface explains much of the gap.
“The fatigue life of parts fabricated by [3D printing] depends on the quality of the surface finish.”
— Chan, Koike, Mason & Okabe, Metallurgical and Materials Transactions A, 2013 Chan, K.S., Koike, M., Mason, R.L., and Okabe, T. "Fatigue Life of Titanium Alloys Fabricated by Additive Layer Manufacturing Techniques for Dental Implants." Metallurgical and Materials Transactions A 44 (2013): 1010–1022.
The study
The study set up by Chan collected data on 3D-printed titanium parts to see if they could replace the traditional wrought and machined titanium in dental implants. Chan, K.S., Koike, M., Mason, R.L., and Okabe, T. "Fatigue Life of Titanium Alloys Fabricated by Additive Layer Manufacturing Techniques for Dental Implants." Metallurgical and Materials Transactions A 44 (2013): 1010–1022. They printed Ti‑6Al‑4V two ways: electron beam melting (EBM) and laser beam melting (LBM). The wrought titanium control that's relevant to framebuilding was Ti‑6Al‑4V.
Each test piece was stressed in three-point bending at 10 cycles per second until failure. The peak stress on the outer surface was 600 MPa every cycle, with a stress ratio R of 0.1. That means the load was always positive, never reversed; it cycled between 10% and 100% of peak. Ten additively manufactured samples were fatigued for each fabrication type.
How to read the chart. Each strip shows 1 mm (0.04″) of surface length. All four strips share one scale, and height is drawn at twice the horizontal scale. Each strip's peak-to-valley height is given in microns on the left and in inches on the right, where a bracket spans it from the highest peak to the deepest valley. The light gray fields behind the two laser printed profiles mark the same span.
How rough is each surface?
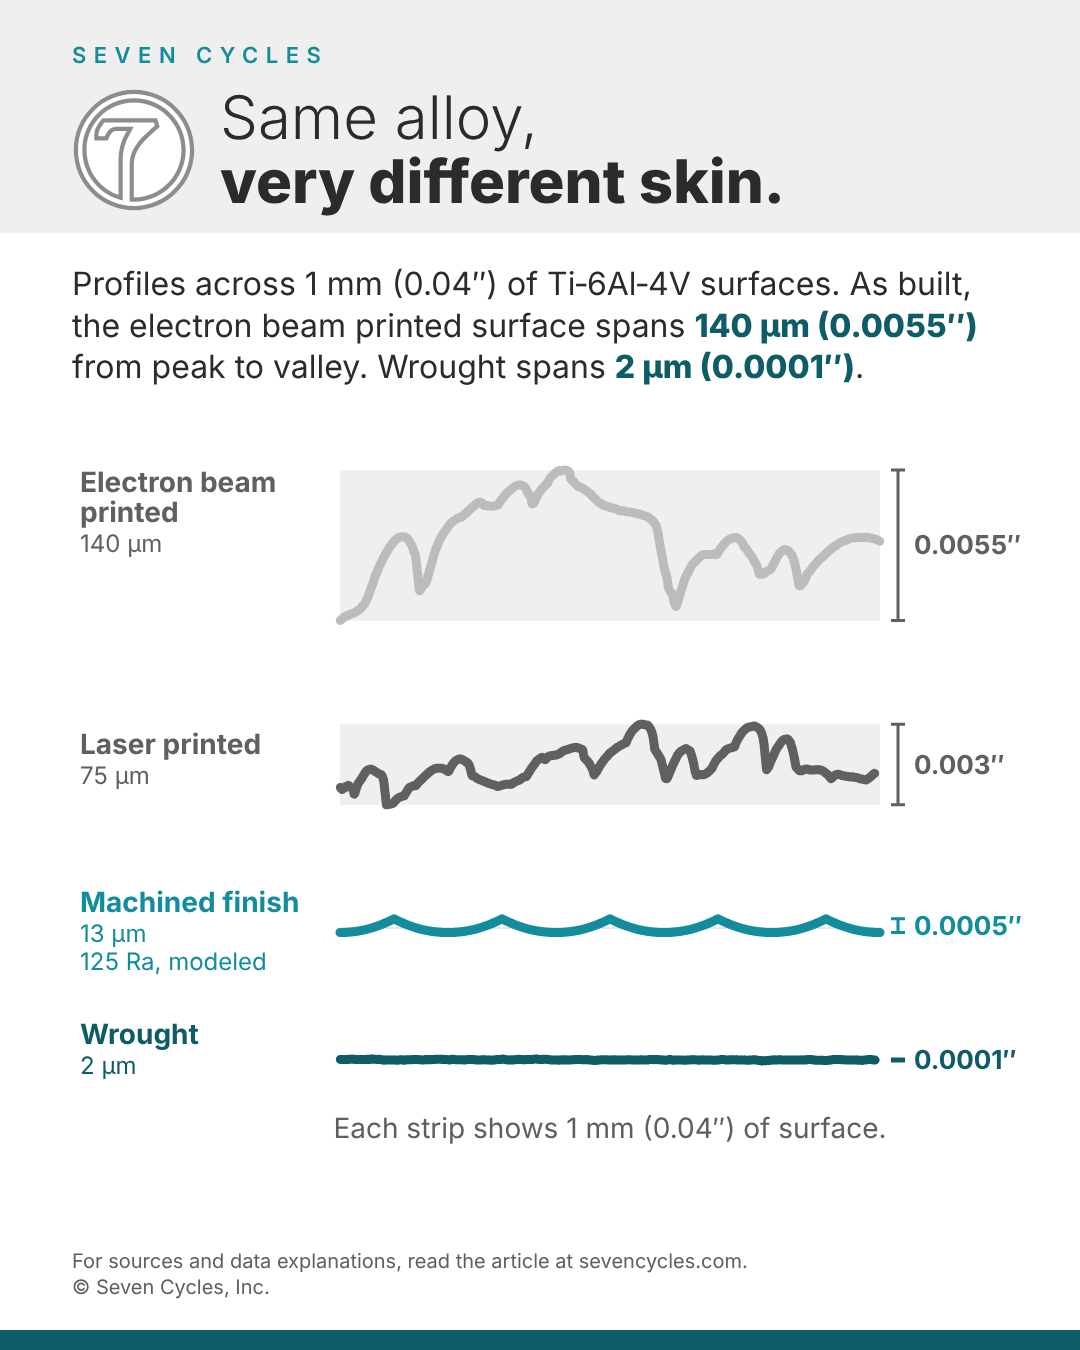
The printed and wrought strips are the study's profilometer scans. Chan, K.S., Koike, M., Mason, R.L., and Okabe, T. "Fatigue Life of Titanium Alloys Fabricated by Additive Layer Manufacturing Techniques for Dental Implants." Metallurgical and Materials Transactions A 44 (2013): 1010–1022. The machined strip is our model of a standard 125 µin Ra (3.2 µm) finish, added for comparison: identical tool marks repeating every 0.2 mm. We drew its peak-to-valley height at 4x its Ra, about 13 µm, which is typical of precision machining with good fixtures and tooling. Rougher machining can reach 8x.
What the chart shows. The electron beam printed surface swings 140 µm (0.0055″) from peak to valley. The laser printed surface swings 75 µm (0.003″). A 125 Ra machined finish spans about 13 µm (0.0005″), and the wrought plate spans 2 µm (0.0001″).
The printed roughness comes from the build. Partly melted powder grains stick to the surface, and the e-beam parts also had unfilled gaps between layers. The authors found the printed surfaces' maximum roughness roughly matched the layer thickness: 100 µm layers for e-beam, 40 µm for laser. Under the microscope, cracks started in the sharp notches between those grains.
How long each group lasted
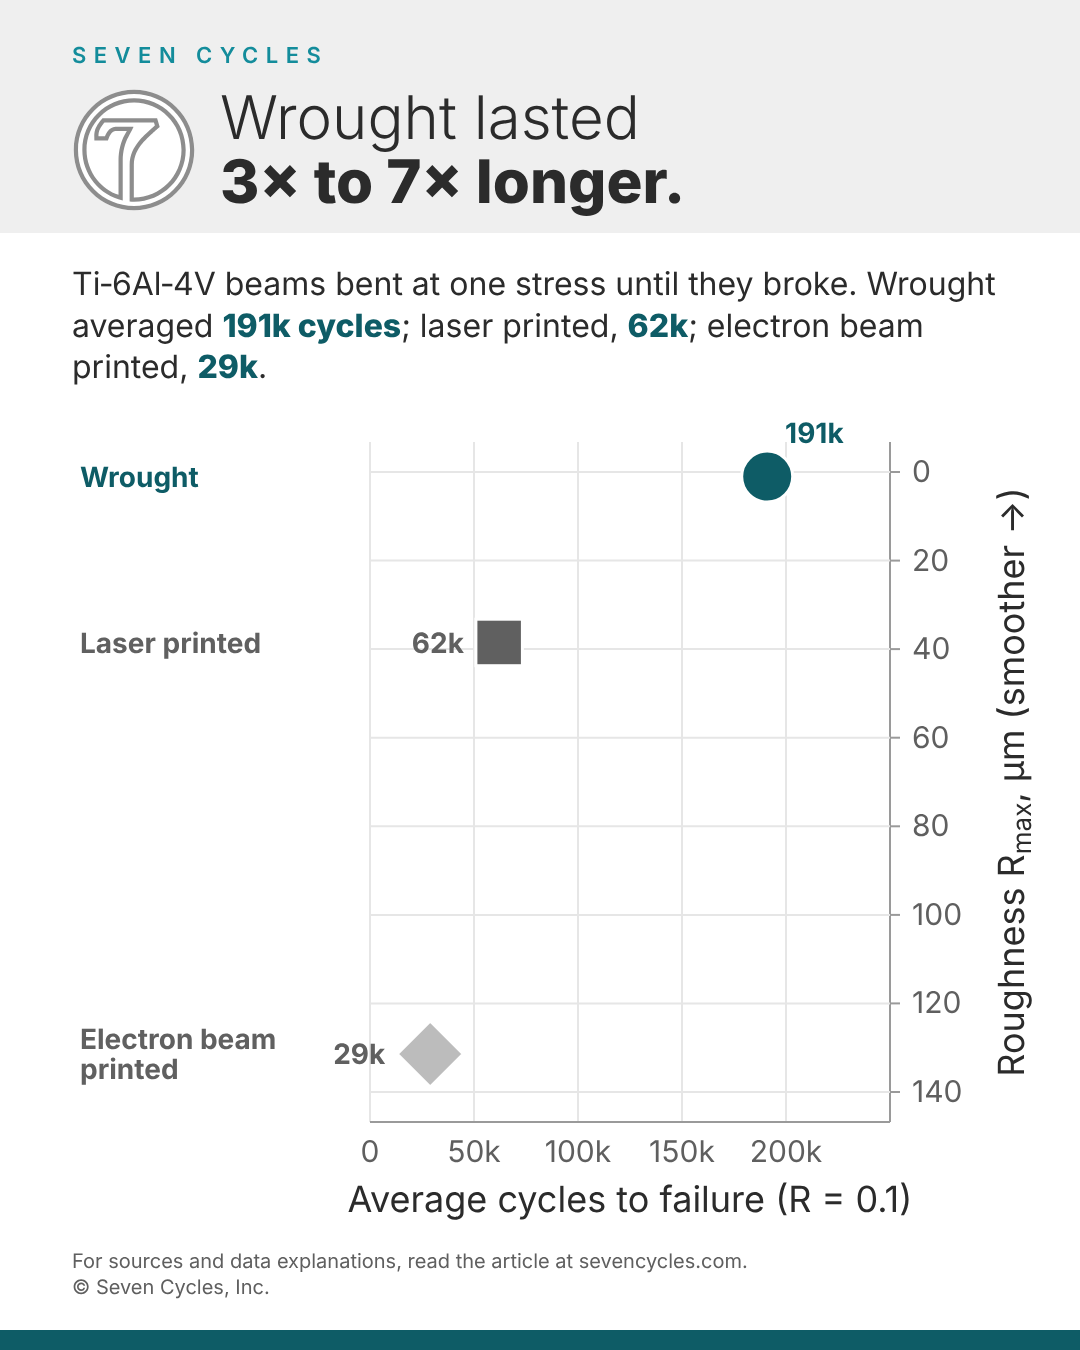
How to read the chart. Each mark is a group's average cycles to failure, read on the bottom axis. Each mark also sits at its maximum roughness (Rmax), read on the right-hand axis: 0 to 140 µm, smoothest at the top. The values come straight from the paper's Table II. Chan, K.S., Koike, M., Mason, R.L., and Okabe, T. "Fatigue Life of Titanium Alloys Fabricated by Additive Layer Manufacturing Techniques for Dental Implants." Metallurgical and Materials Transactions A 44 (2013): 1010-1022. The authors plotted these results as survival curves; for clarity we show the averages instead.
What the chart shows. Wrought Ti-6Al-4V lasted 300% longer than the laser printed parts and over 600% longer than electron beam printed parts. The roughest surface failed first. As-built electron-beam parts were about 3x rougher than laser parts and lasted about half as long.
We show both LBM and EBM because both are relevant in the bike industry. Most frame and component builders use laser beam melting equipment. There are a few that have started using electron-beam melting, too.
What the animation shows. The animation opens on a thin-walled titanium cylinder with a 0.040″ wall. It's length and diameter are equal. We cut it in half lengthwise and zoom in on the face of the cut wall. That cross-section becomes the top strip of three, the electron beam printed wall. The laser printed and wrought strip versions are shown below the first. Each wall is clamped at the left and bent cyclically at the right end until it breaks. The counter and the bars track the load cycles. Each bar stops where its wall breaks. The bars compare the three lives at a glance.
What is to scale. Wall thickness, length, surface roughness, and voids share one scale. The surfaces are the measured profiles from the study's Figure 4. Chan, K.S., Koike, M., Mason, R.L., and Okabe, T. "Fatigue Life of Titanium Alloys Fabricated by Additive Layer Manufacturing Techniques for Dental Implants." Metallurgical and Materials Transactions A 44 (2013): 1010-1022. Each wall's label gives the peak-to-valley height of the scan it's drawn from: 140, 75 and 2 µm.
The voids come from a second study that counted them on polished cross-sections of printed Ti-6Al-4V (Fousová et al., 2018). Fousová, M., Vojtěch, D., Doubrava, K., Daniel, M., and Lin, C.-F. "Influence of Inherent Surface and Internal Defects on Mechanical Properties of Additively Manufactured Ti6Al4V Alloy: Comparison between Selective Laser Melting and Electron Beam Melting." Materials 11, 2018: 537. (pore counts and sizes in the animation)
What is amplified or simplified. The bending is exaggerated so you can see it. Each wall is loaded in one direction only, like the test (R = 0.1). The counter runs at a steady rate, so each wall breaks at its Table II cycle count and the break times keep their true ratios. The walls flex on screen far slower than the counter runs.
Watch three walls fail
The numbers
Printed Ti‑6Al‑4V lasted only a third as long as wrought, or less.
| Ti‑6Al‑4V group | Rmax, µm | Mean fatigue life, cycles, R = 0.1 | vs. wrought |
|---|---|---|---|
| Wrought | 1.03 | 190,980 | 100% |
| Laser printed, as built | 38.5 | 62,113 | 33% |
| E‑beam printed, as built | 131.43 | 28,961 | 15% |
Why it matters for bike frames
Frames fail from fatigue, not from one big hit. Pedaling, bumps, and braking bend the tubes and joints millions of times. Fatigue cracks usually start at a surface flaw, and this study shows how much a flaw costs under bending.
A few builders polish their printed parts. This helps some but not enough. We'll show data on this in another article. Regardless, a printed dropout, yoke, or lug keeps its as-built skin wherever a grinding, sanding, or polishing tool can't reach, such as the inside of a hollow section. A frame's life is set by its weakest point, and on a printed part that spot is often the inner surface of a thin walled shell that no tool can reach.
Caveats
The test samples were small (about 30 x 2.5 x 4 mm for the printed groups) and tested at one stress level. The trend carries over to frames, but the cycle counts don't.
The surface profiles are one scan per surface, taken from the figure's vector data. Peak-to-valley heights are Seven Cycles' reading of those scans.
Seven Cycles redrew Figures 4 and 7. Chan, K.S., Koike, M., Mason, R.L., and Okabe, T. "Fatigue Life of Titanium Alloys Fabricated by Additive Layer Manufacturing Techniques for Dental Implants." Metallurgical and Materials Transactions A 44 (2013): 1010-1022.
The Chan paper calls its roughness figure "maximum Ra" and treats it as notch depth. It behaves like Rmax, the maximum profile height, rather than the average-based Ra used for machined finishes, so we label it Rmax. The profile chart and the animation show single scans from Figure 4, so their heights can differ from these multi-scan summaries: laser measures 75 µm in its plotted scan and 39 µm here.